Pass it, keep it, get paid — eight futures prop firms, side by side

What it takes to pass, what takes the account away, and what holds up a payout — for every account we support, read from each firm's own pricing pages, help centres and rule books, not summarised from memory.

The drawdown that isn't on your screen

R|Trader Pro shows you unrealized P&L. What actually closes the account is a floor computed underneath it. A trailing floor moves up in real time as your equity climbs and can be breached mid-trade, even on a day you finish green. An end-of-day floor only recalculates once, at the close. Which one your account uses — and when it stops moving — changes what counts as a breach.

The daily loss limit

Where a firm publishes one, crossing it suspends trading for the rest of that session — the account itself stays open and picks back up the next day. It's a separate number from the drawdown, measured only on that day's losses, and on some accounts it scales up as the account grows.

The consistency rule

A cap on how much of total profit is allowed to come from a single day, written as a percentage. It exists to stop a payout being decided by one outsized session — hit the target with one lucky day and the rule can hold the payout back even though the profit itself is real.

The numbers

Glossary

The six terms that show up in every row of the table above.

Trailing intraday drawdown
The floor follows your equity up in real time, on every trade — not just at the close. It can be breached mid-session even if you end the day in profit, and once it locks (see below), it stops following.
End of day (EOD) drawdown
The floor recalculates once, at the close of each trading day, based on that day's balance. An intraday dip that recovers before the close doesn't touch it.
Static drawdown
The floor is set once, as a fixed dollar level, and never moves — not up with profit, not with anything else. Rare among the accounts here, but not unheard of.
Locks at
The dollar level at which a trailing or end-of-day floor stops moving upward for good, even if the balance keeps climbing after that point.
Daily loss limit (DLL)
A separate ceiling on a single day's losses. Crossing it suspends trading until the next session — it's a soft breach, not the end of the account, and not every firm publishes one.
Consistency rule
A percentage cap on how much of total profit can come from your single best day. Meant to keep a payout from being decided by one outsized session rather than a track record.

Prohibited practices, and their published consequences

Nine trading behaviors, eight firms, read .

Allowed Restricted Prohibited Not stated Derived — our deduction, not their words

Rules only one firm has

The rules you can check from your own CSV

Some of the nine voices above aren't opinions — they're arithmetic, and the app already does the math.

Trade duration

Four of the eight firms define scalping by how long you hold a trade — with four different numbers:

FirmThresholdForm
Lucid5 seconds>50% of profit from trades under threshold
Tradeify10 seconds>50% of trades AND >50% of profit above threshold
YRM10 secondsMinimum on every trade
TradeDay“a few seconds” + >200 trades/dayJudgment + count

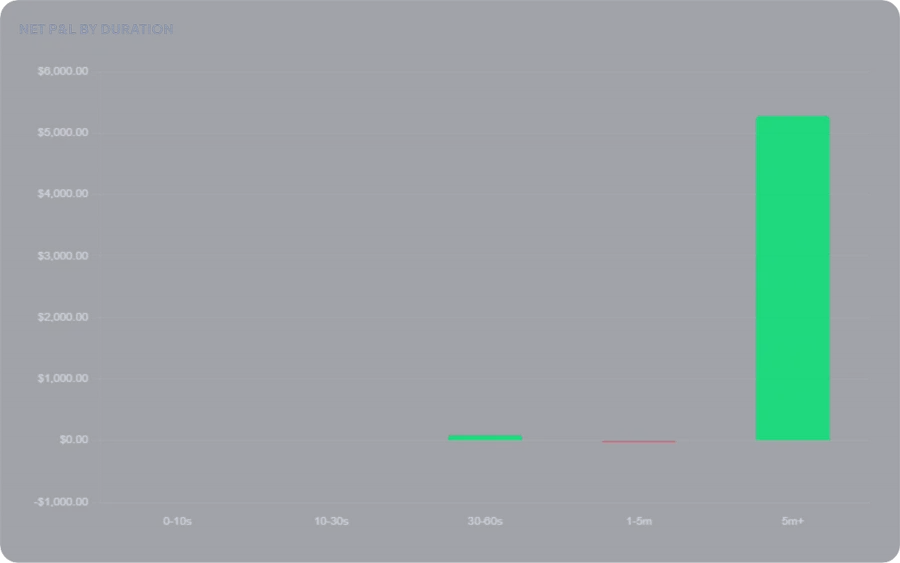
The 10-second line answers Tradeify and YRM exactly. Lucid's threshold is 5 seconds and falls inside the first bucket below — neither image separates it out on its own.

Net P&L by trade duration chart, bucketed 0-10s, 10-30s, 30-60s, 1-5m, 5m+, showing how much profit comes from trades under ten seconds

This is the rule, not an illustration. FundedMetrics' duration buckets start exactly at 10 seconds — the same line Tradeify and YRM publish — so the share of profit sitting in that first bar answers the question directly.

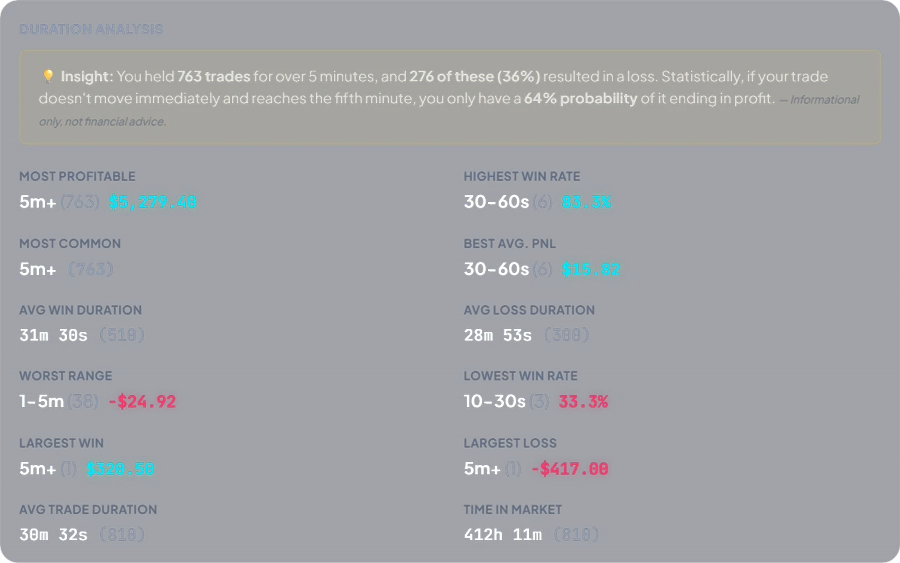
Duration analysis card showing average trade duration, average win and loss duration, most frequent duration bucket, and time in market

The supporting card: average trade duration, average win/loss duration, and time in market.

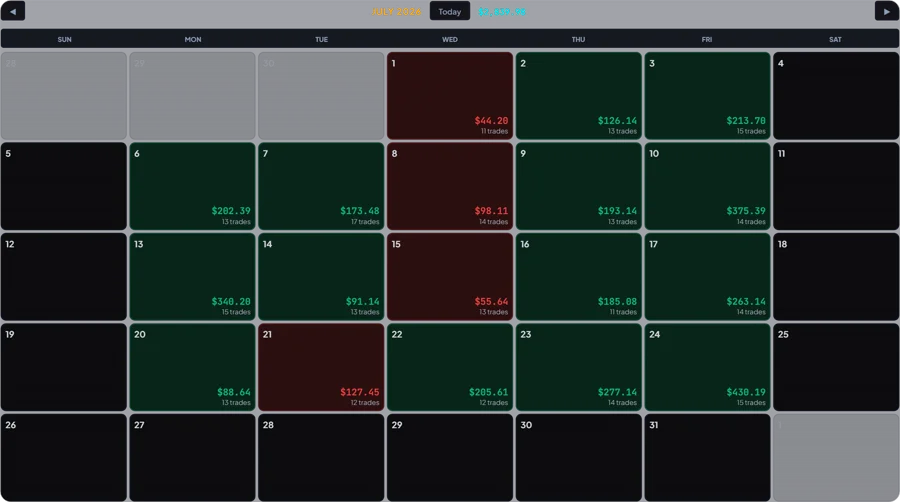
Monthly calendar view with each trading day showing net P&L and its own trade count

Each day already shows its own trade count — the same number TradeDay and YRM cap at 200.

Trades per day

TradeDay and YRM cap it at the same number, in nearly the same words: “more than 200 trades in a day” is prohibited on both. It's a per-day count, and the calendar already keeps one for every day you've traded.

How we verify this

Every number here has a source, and the source has a date.

Where the numbers come from. Each firm's own published material: pricing pages, help center articles, and — where available — the purchase form itself, which is the strongest source we use, because it's what a customer reads while paying for the account.

Where two official pages disagreed with each other, we recorded which one we trusted and why, instead of quietly picking one and moving on.

What this page doesn't cover:

  • Contract/position-size scaling as an account grows
  • Position limits
  • Inactivity rules
  • Withdrawal caps and payout schedules
  • Profit split percentages
  • Products a firm has discontinued or stopped selling
  • Sizes that appear in an article but never at checkout
  • Rules on holding multiple accounts
  • KYC and identity verification
  • Chargebacks
  • Affiliate programs

A rule we didn't find isn't a rule that doesn't exist. It means that on that firm's public surfaces, on the date above, we didn't find it there.

Rules change without notice. The date on this page is the date we last read the firm's own pages — not a promise about today. Confirm with your firm before trading around any number here.

No affiliate links on this page, and no discount codes. We don't earn anything if you buy an account with any of these firms.
Your journal should already know these numbers

Pick your account, upload your R|Trader Pro CSV, and the tracker knows your limits — drawdown, daily loss, consistency, minimum days. No manual setup.

See the 75-second demo → Start journaling now 14-day free trial, no card • From $8.33/mo billed annually • $9.99 monthly • cancel anytime