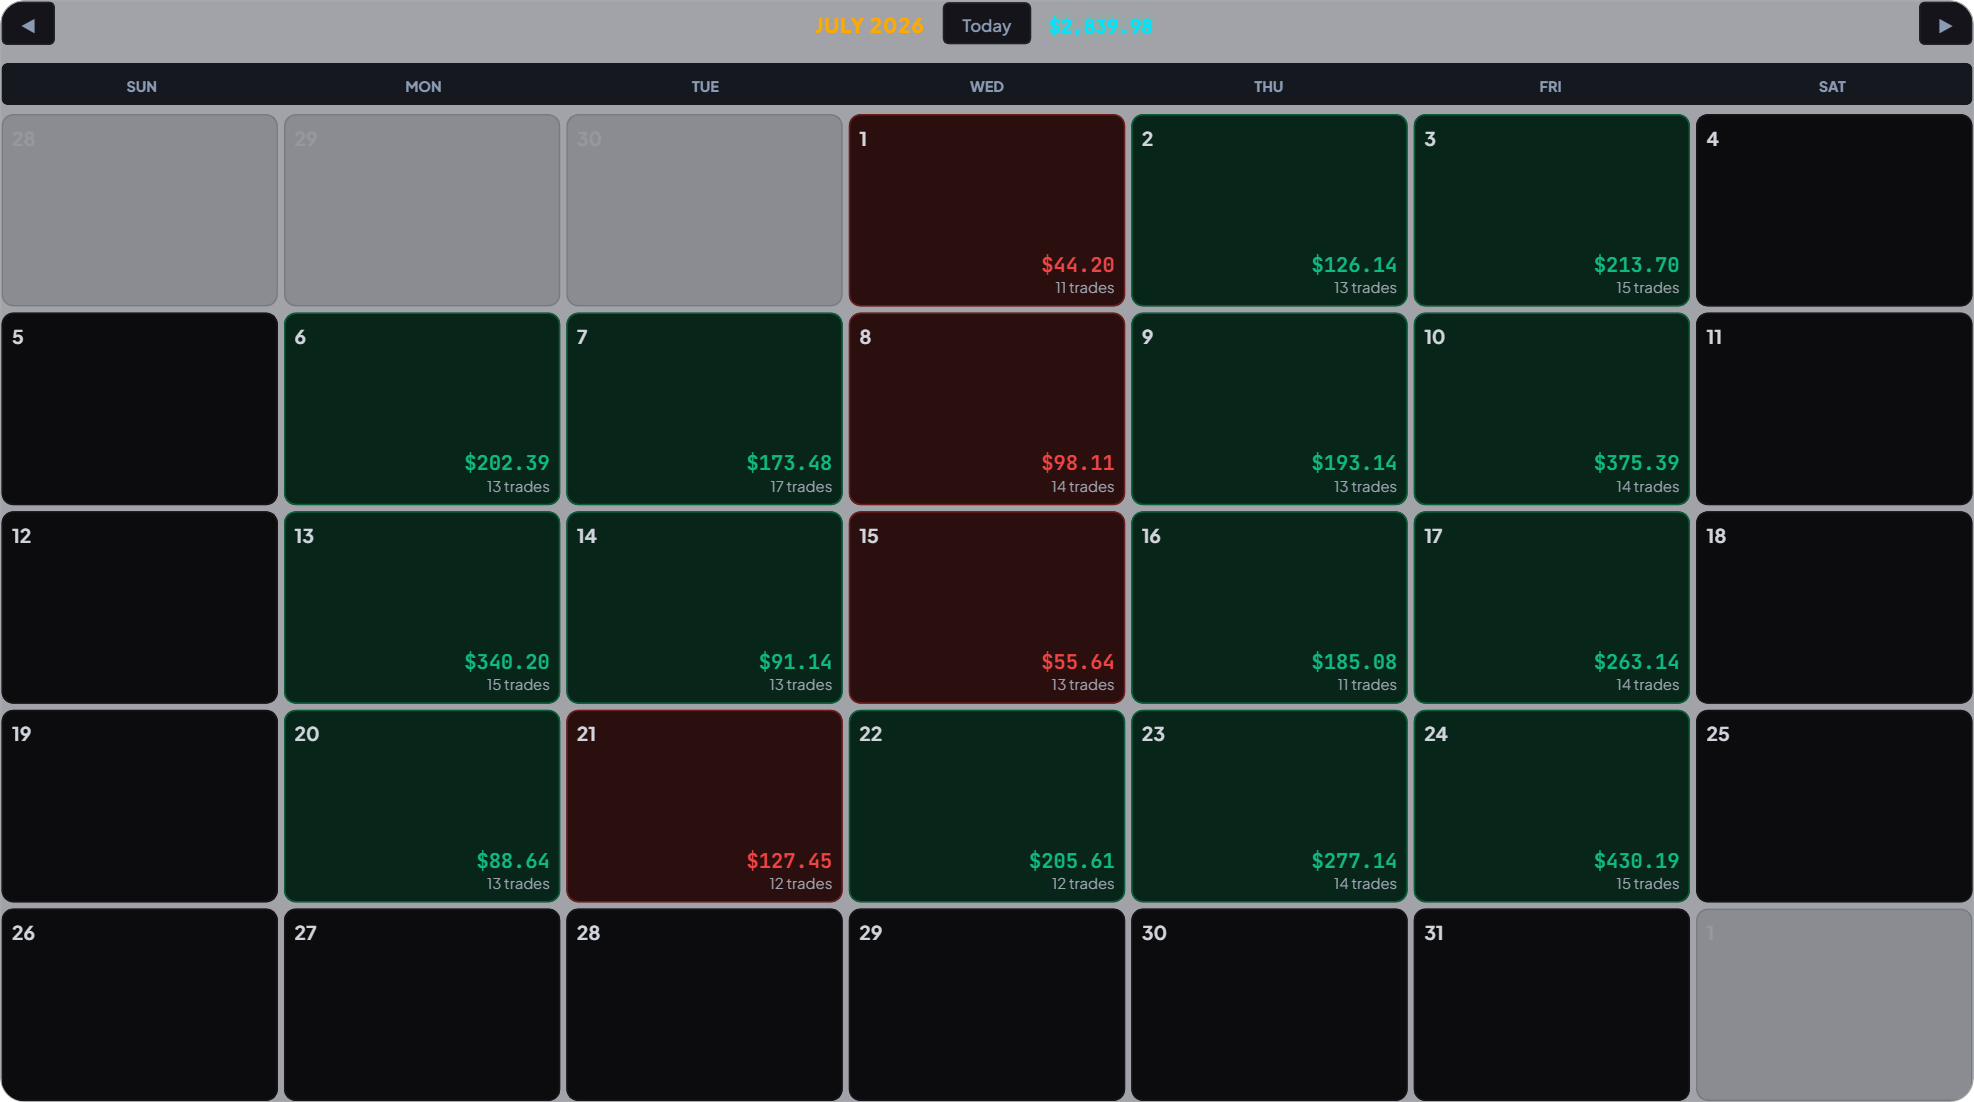
Automated Trade Journaling
Journaling made effortless. Say goodbye to manual data entry. Upload your Rithmic CSV and watch as your entire trading history is instantly logged, categorized, and visualized.
Your accounts run on Rithmic. Drop in the R|Trader Pro CSV and get the drawdown your firm actually saw, your hold times, and the published rules of eight futures prop firms — checked against your own trades.
Any Rithmic account works — another prop firm, or your own broker.
Drawdown, daily loss limit, consistency and minimum days are pre-loaded from each firm's published rules — pick your account and the tracker knows the limits. With a firm that isn't listed, start from the closest preset and change what differs — or enter your own numbers from scratch. See all eight rule sets side by side, each with the date we last checked it.
Firm names are trademarks of their respective owners. FundedMetrics is not affiliated with, endorsed by, or sponsored by any of them.
From CSV to insight in under a minute.
Open R|Trader Pro, go to Trade History, select your account and date range, then export to CSV. Full instructions are in our in-app guide.
Upload the file into your dashboard. We parse it instantly and build your full trade history — no manual entry, no spreadsheets.
See your FM Score, drawdown, challenge progress, and AI-powered insights the moment your data lands. Know exactly what to fix.
From challenge to funded, from funded to payout, one dashboard.
Journaling made effortless. Say goodbye to manual data entry. Upload your Rithmic CSV and watch as your entire trading history is instantly logged, categorized, and visualized.
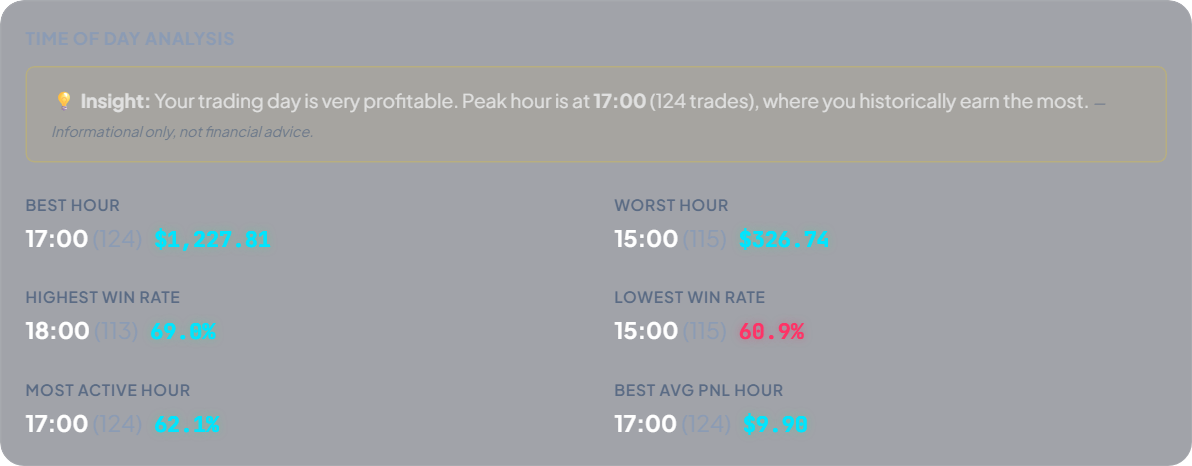
Dive deep into your data. Our advanced reports break down your performance to reveal your best trading hours, most profitable setups, and where you're bleeding money.
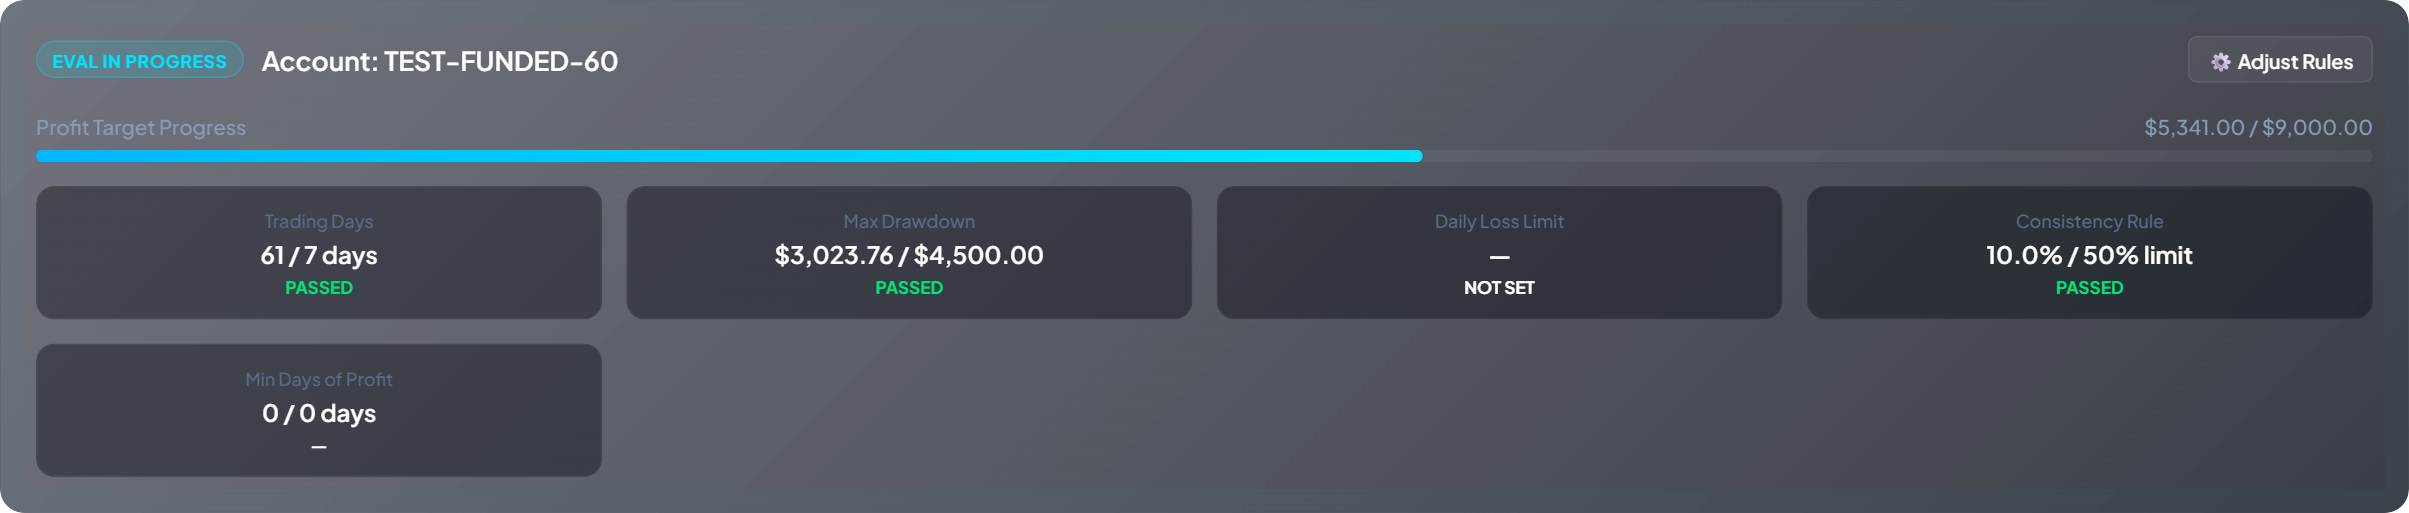
Protect your funded accounts. See the true peak-to-valley drawdown your firm saw — trade by trade, after every session. Know exactly how close you came, before it costs you a challenge.
FundedMetrics reads your closed trades and tells you what the numbers support — your tilt after a bad day, the hour that costs you, the losers you hold too long. No chat, no predictions: statistics on your own history.
You continued trading after hitting your adaptive daily drawdown limit of $420 on 4 days, adding $650 in losses a hard stop would have prevented.
Your losing trades stay open 3.2x longer than your winners on average (4m 10s vs 1m 18s). Consider a cutoff closer to 1m 18s instead of letting losers run indefinitely.
On your high-activity days (9+ trades) you paid $340 in commissions and averaged -$180 in net P&L — against +$210 on quieter days. Cutting trade counts on those days would reduce the commission drag.
And when there's nothing to say, it says nothing. Every insight is triggered by something that actually happened in your trades — never generated to fill a box.
Not financial advice.
Built exclusively for traders who treat their capital with respect.
You keep failing challenges because of hidden intraday drawdowns. We rebuild them trade by trade, so you finally see them — and stop repeating them.
You finally got the funded account. Now your only job is to protect it until the payout. Use our stats to minimize risk and scale your edge.
You make money in the first hour, and give it all back by the afternoon. The Golden Hour feature shows you exactly which hour is costing you — so you know when to walk away next time.
No credit card required. Cancel anytime.
We're continuously working on improving FundedMetrics. Let us know if you have suggestions or feature requests at info@fundedmetrics.net.
Still deciding? Here's what traders usually ask first.
Any account that runs on Rithmic. FundedMetrics reads the CSV you export from R|Trader Pro, so your trades import the same way whether the account comes from a prop firm or from your own futures broker. You don't need anything from your firm or broker to get started.
Those are trading platforms, not what clears your account. What matters is whether your account runs on Rithmic — most futures prop firm accounts do, regardless of which platform you place orders from. FundedMetrics works the same way with any of these: ATAS, Bookmap, Jigsaw Trading, MotiveWave, MultiCharts, NinjaTrader, Optimus Flow, Overcharts, Quantower, Sierra Chart, Tradesea, WealthCharts, and more — export from R|Trader Pro (not from your trading platform's own trade history) and upload that CSV. It works exactly the same. If your account doesn't run on Rithmic, we don't support it yet.
Most journals were built for stocks and options, and treat drawdown as a single number at the end of the day. FundedMetrics is built around the rule that actually ends prop accounts: it rebuilds your equity curve trade by trade, so you see the true peak-to-valley drawdown your firm saw — and how close you came — on every session.
Yes. Your password is encrypted and never stored in readable form, all traffic runs over HTTPS, and your trade data is used only to power your own dashboard — never shared or sold. See our Privacy Policy for the full details.
Yes. You can cancel your subscription at any time, and you'll keep access until the end of your current billing period. See our Terms of Service for details.
Yes — 14 days, and we don't ask for a card. You register with an email and a password and your dashboard opens straight away, with your own Rithmic CSV inside it. Nothing is charged, and there is nothing to cancel: when the fourteen days are over the dashboard simply stops opening, and your uploaded data stays where it is in case you come back. If you decide to continue it's $9.99/month, and checkout is handled by Dodo Payments, our authorised reseller and Merchant of Record, who also issues your invoice — we never see or store your card details. You can cancel at any time and keep access until the end of the period you've already paid for. You can also see the whole product before registering: watch the dashboard demo video — 75 seconds, no signup.
No. FundedMetrics is an independent analytics tool built to read Rithmic CSV exports. We are not affiliated with, endorsed by, or sponsored by Rithmic, LLC.
FundedMetrics is a post-session analysis tool: you upload your CSV after you're done trading, and it reconstructs exactly what happened, trade by trade, including your true peak-to-valley drawdown. It's built for honest review after the session.
Upload your Rithmic CSV and turn raw fills into a complete performance picture.